Predicting Crop Yields in a Changing Climate
Python · Prophet · Data Science · Visualization
Climate change isn’t just news—it’s something that’s already changing the way we grow our food. I wanted to see, with real data, how rising temperatures might change crop yields around the world. So, I used open datasets and built forecasts with Prophet (a time series tool) to predict what could happen to crops in the next few years. My goal? Turn all that data into something useful that farmers and decision-makers can actually use.
Food security needs clear vision. Even a little change in weather can mean a lot for food and for people’s lives. I wanted my project to give helpful, honest forecasts—so farmers can plan ahead, and leaders can prepare for what’s coming.
- Help farmers and businesses get ready for a changing climate.
- Give useful info to people making policies or running food programs.
- Strengthen food supply chains against climate surprises.
- Gathered the data: I pulled together crop yield and climate data, cleaned it up, and filled any gaps.
- Engineered new features: Made new climate indicators to help my model predict better.
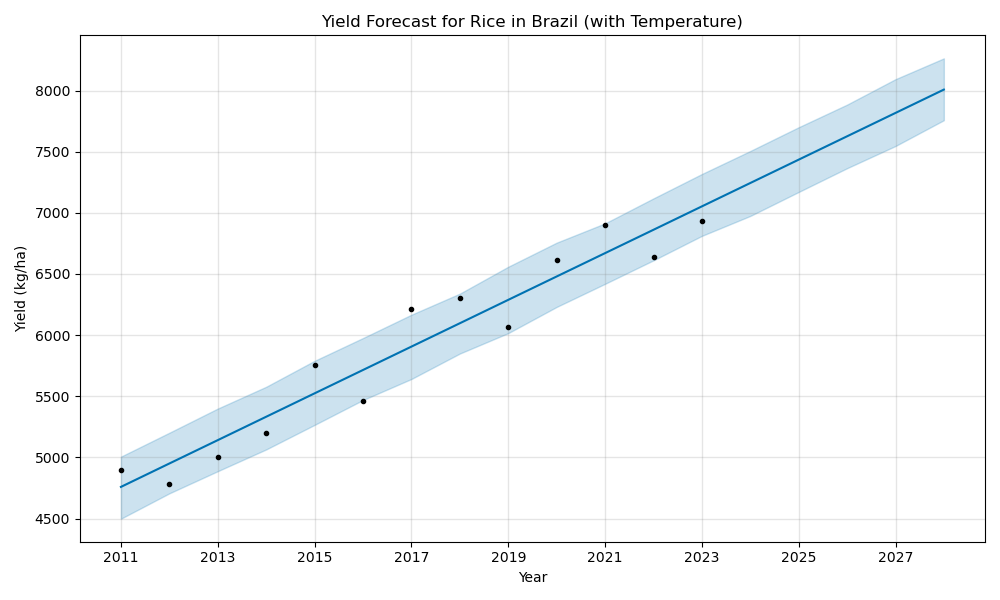
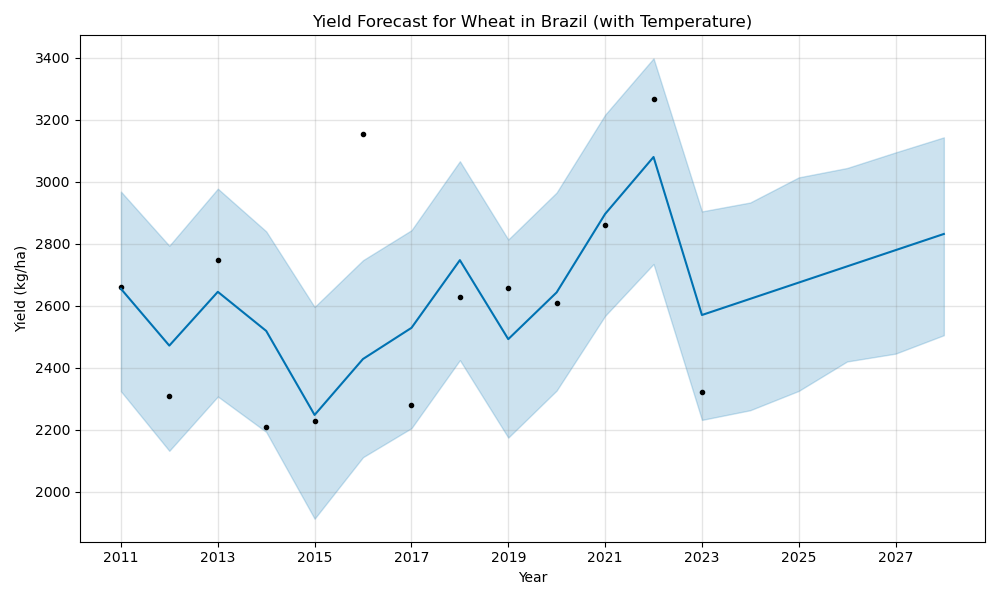
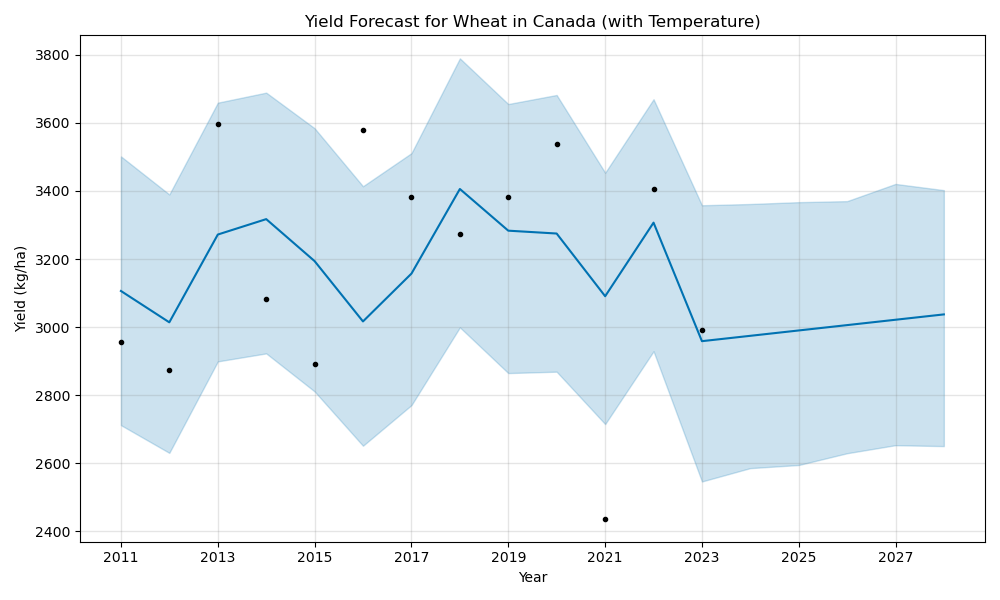
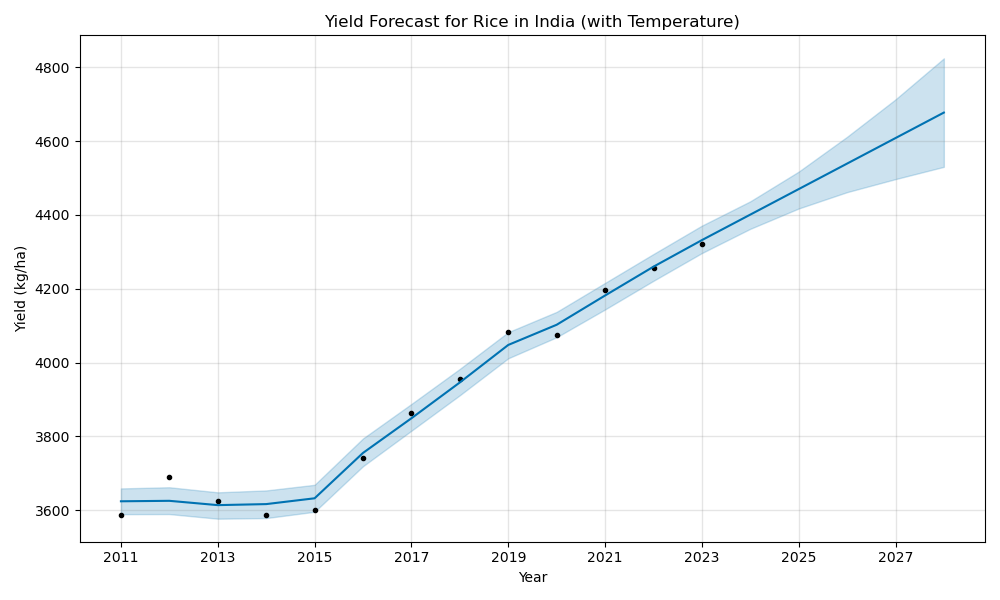
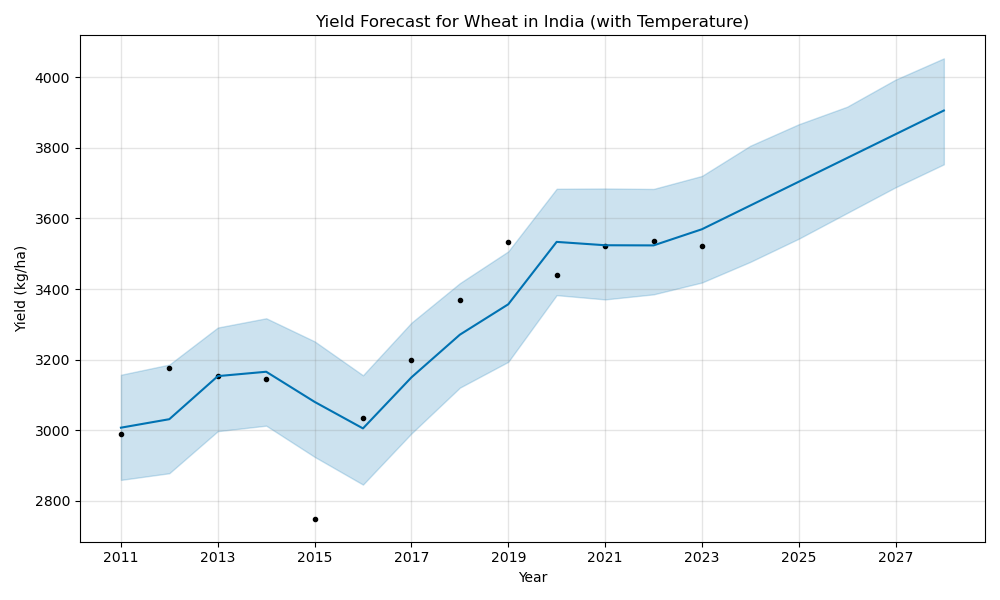
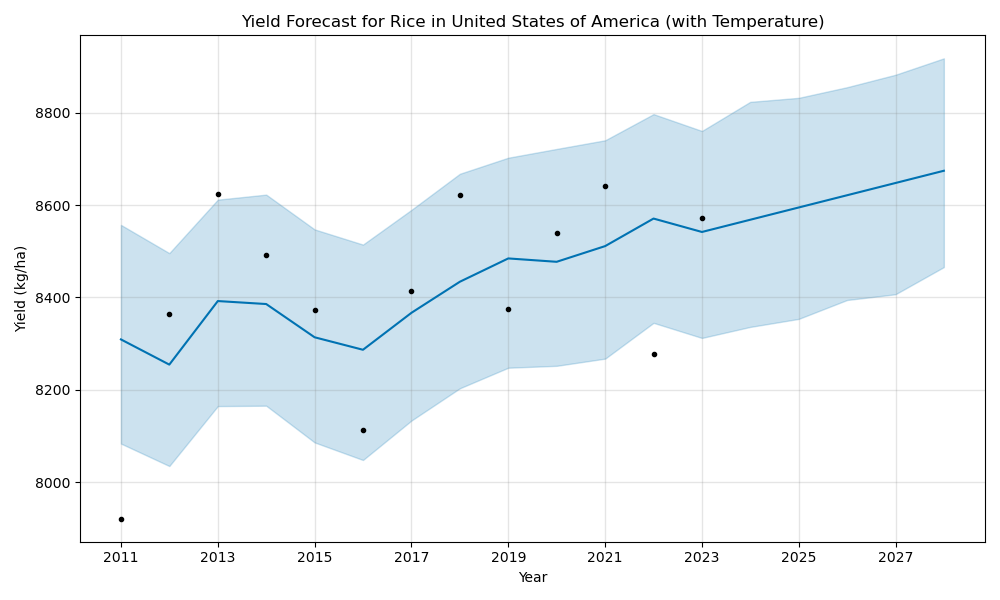
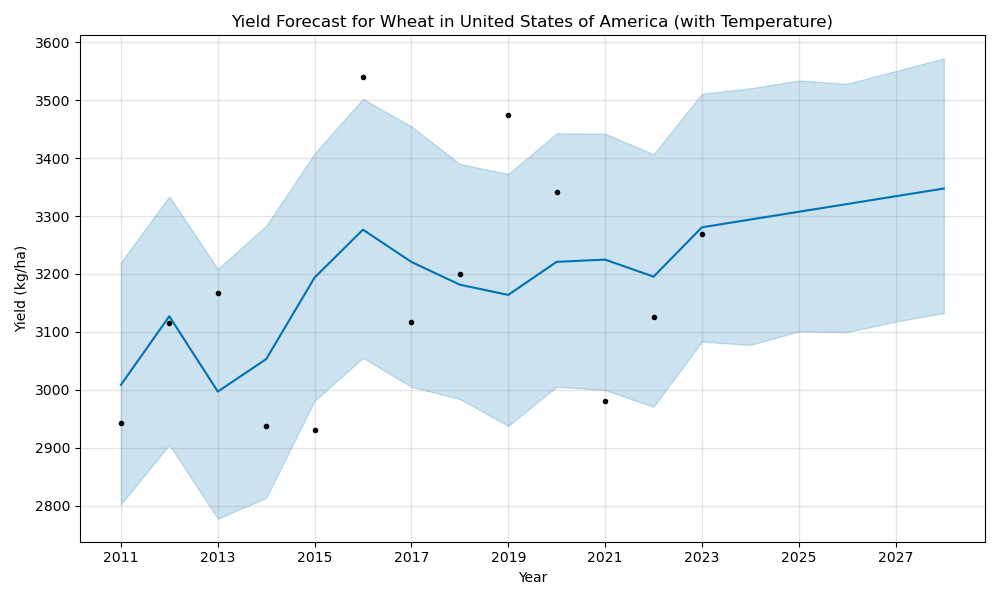
- Built the models: Used Prophet to make forecasts for each country and crop, adding temperature as a key input.
- Visualized the results: Made clear charts showing five-year forecasts, with confidence ranges so people can see the risks.
_forecast.png)
_forecast.png)
_forecast.png)
_forecast.png)
- Some crops and places are way more sensitive to heat than others—it’s not the same everywhere.
- Showing “uncertainty” in charts actually helps people see the risks and make better choices.
- I made the process flexible, so it’s easy to use with new countries, crops, or climate data.
For me, this project wasn’t just about building a model. It was about using data to make a real impact—giving people the knowledge to adapt and protect our food. It proved to me that data science can help make better decisions and spark real change, not just predictions.
- Python (pandas, Prophet, matplotlib)
- Jupyter Notebook
- Data Visualization
- HTML5 & CSS3 (for this presentation)